Fig. 1.

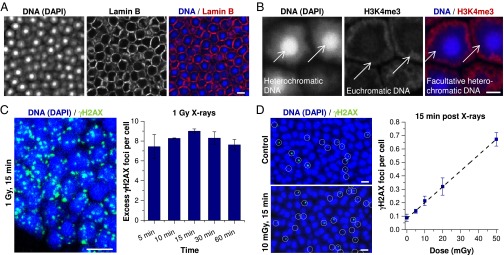
γH2AX foci in mouse photoreceptors after low X-ray doses. (A) IF image of Lamin B in mouse photoreceptors. (Scale bar: 5 µm.) (B) IF image of H3K4me3 in mouse photoreceptors. Different chromatin regions in the nucleus are indicated by white arrows. (Scale bar: 2 µm.) (C) Time-dependent quantification of γH2AX foci per cell after receipt of 1 Gy X-irradiation. Retinae were left unirradiated or were analyzed at 5–60 min postirradiation. (Left) IF image (maximum intensity projection, MIP) of γH2AX in irradiated photoreceptors. (Scale bar: 5 µm.) (Right) Spontaneous γH2AX foci (fewer than 0.1 per cell) were subtracted. Error bars represent the SD between two retinae with 40 cells each. (D) Quantification and regression analysis of γH2AX foci per cell after various X-ray doses. Retinae were left unirradiated or were analyzed at 15 min after receipt of 5–50 mGy. (Left) IF images (MIP) of γH2AX in unirradiated or irradiated photoreceptors. γH2AX foci were framed with white circles for better visualization. (Scale bars: 5 µm.) (Right) Error bars representing the SD among three retinae with 1,500 cells each (R2 = 0.994).
