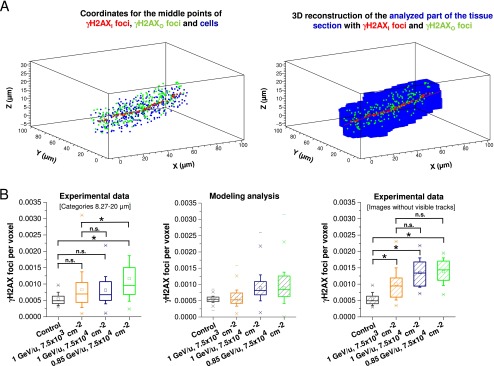
Fig. S3.

Radial and longitudinal analysis of γH2AX foci induction after particle irradiation. (A) Reconstruction of the analyzed part of the tissue section. (Left) Coordinates for the middle points of all γH2AXI (red) and γH2AXO foci (green) and all nuclei (blue) inserted into a 3D-histogram. (Right) The analyzed part of the tissue section (shown in blue) reconstructed from the middle points of the cells at a voxel resolution of 0.8 × 0.8 × 0.645 µm3. (B) Analysis of the fluence dependency of the background dose. (Left) The last six distance categories of Fig. 3A (corresponding to foci with a distance to the ion trajectory between 8.27 and 20 µm) were pooled for each irradiation condition and compared with the distribution of spontaneous foci per voxel. This latter value was obtained from images of unirradiated control retinae from the experiments shown in Fig. 3A by transforming foci per cell into foci per voxel using the conversion factor of 233.4 voxels/cell. All three irradiation conditions show higher foci levels than the control sample, although the differences are statistically significant only for Ti ions with 0.85 GeV/u. Moreover, only one of the two higher fluences shows increased foci levels compared with the low fluence condition. (Center) Modeling analysis for the expected distribution of foci per voxel for the three irradiation conditions in the left panel. The unirradiated control distribution of foci per voxel considered a Poissonian distribution of the counted foci. The distribution of the irradiated samples considered two convoluted distributions, a Poissonian distribution for the foci and a “long-tailed” distribution for the doses in the distance categories used for foci counting. This procedure essentially takes the limited experimental dataset in the left panel into account. Of note, the expected variations in foci level for the different fluences are in reasonable agreement with the experimental data. (Right) To enhance the statistical power of the fluence-dependent analysis of the background dose, images from the three irradiation conditions that did not contain a visible ion trajectory were analyzed. These images provide larger areas and therefore more cells for the analysis of the background dose than the last six categories in the left panel. γH2AX foci were enumerated by eye in at least nine images with ∼2,000 cells from one retina (for 0.85 GeV/u) or two retinae (for 1 GeV/u) for each of the three irradiation conditions. The number of foci per cell was transformed into foci per voxel to allow the comparison with the data in the left panel. The results show a clear dependency of the background dose on particle fluence, although the difference between the high and low fluences was smaller than (but not inconsistent with) the expected value of 10. The whiskers of the box (25–75% of the data points) represent the SD between the foci numbers for each irradiation condition. The ranges between the “x” below and the “x” above the boxes encompass 98% of the data. Statistical significance was tested by ANOVA; *P < 0.05; n.s., not significant.
