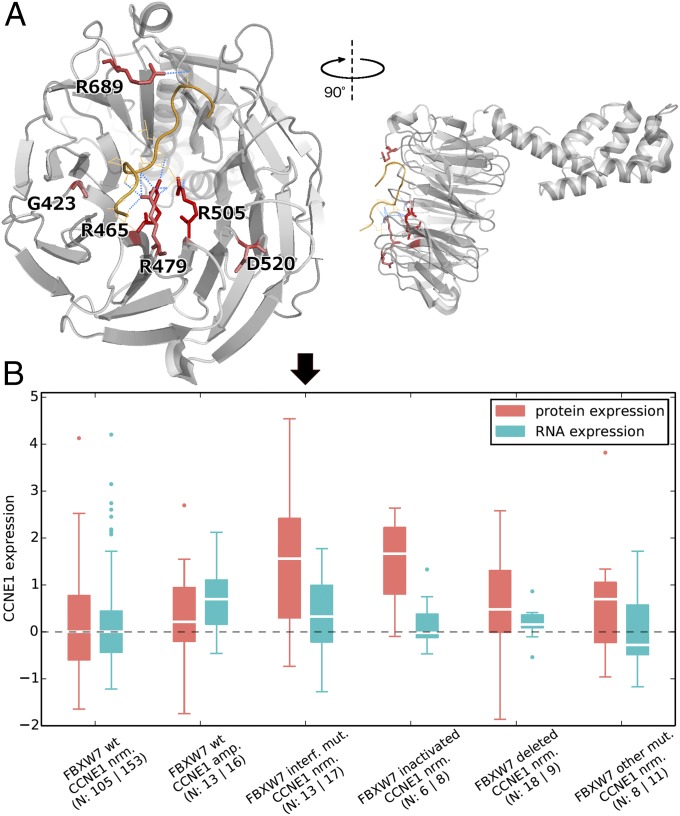
Fig. 5.
Spatial location of FBXW7 mutation hotspots and their effect on CCNE1 protein levels. (A) Crystal structure of FBXW7 (gray) bound to the degron of CCNE1 (orange) (PDB ID code 2OVQ) (44). All recurrently mutated residues (at least three samples) of FBXW7 are shown as red sticks; color intensity scales with recurrence. Hydrogen bonds between such residues and CCNE1 residues are shown as blue dotted lines. (B) CCNE1 protein and RNA levels (as measured by RPPA and RNAseq, respectively) (45) in colorectal cancer samples with different FBXW7/CCNE1 genotypes (“nrm”: normal copy number; “amp.”: amplified, “interf. mut.”: mutation at interaction interface).

