
Fig. 2.
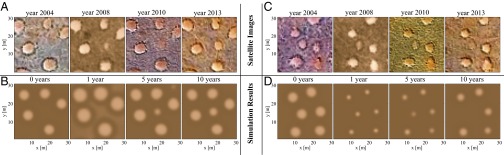
Birth and death of fairy circles as hybrid-state transitions. (A and C) Satellite images showing the dynamics of the appearance/disappearance of a bare soil domain (fairy circle birth/death). (B and D) Snapshots of corresponding simulations using initial conditions derived from the 2004 satellite images shown in A and C. B and D show the simulated response to 1 y of drought/spate (/), after which the precipitation was set back to normal (). The time shown at the top of the satellite image (simulation) denotes the year it was captured (number of years elapsed from the beginning of the drought or the spate). The time intervals between the simulation snapshots were chosen to emphasize the short-time-scale changes in gap size. All panels show the dynamics of a region of .