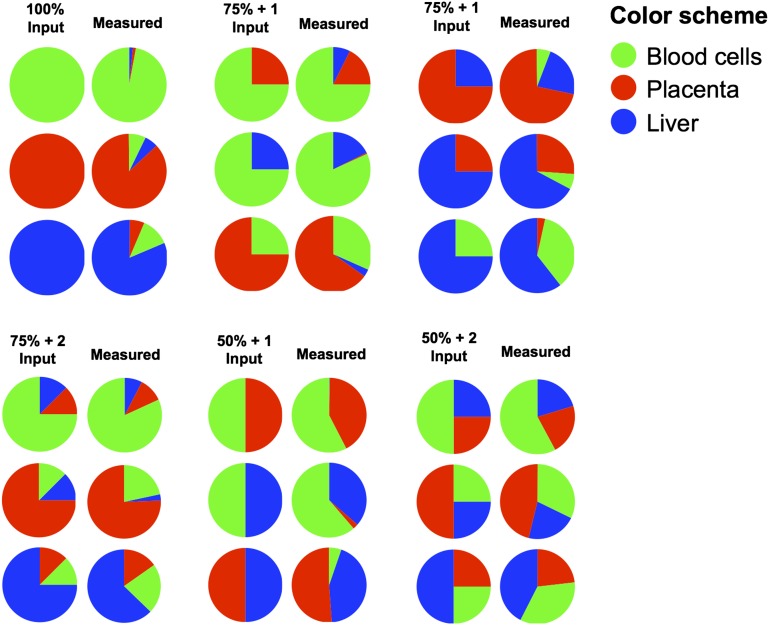
Fig. 2.
Pie charts depicting the results of the tissue DNA mixing experiment. Mixtures of DNA comprising varying input percentages of DNA extracted from the placenta, liver, and blood cells were prepared. The mixtures included 100% input from one of the three tissues (100% input), 75% input of one tissue plus 25% input of one other tissue (75% + 1 input), 75% input of one tissue plus 12.5% each of the other two tissues (75% + 2 input), 50% input from each of two tissues (50% + 1 input), and 50% input of one tissue plus 25% each of the other two tissues (50% + 2 input). Methylation deconvolution was performed for these mixture samples and the measured tissue percentages are shown on the right of each input condition.

