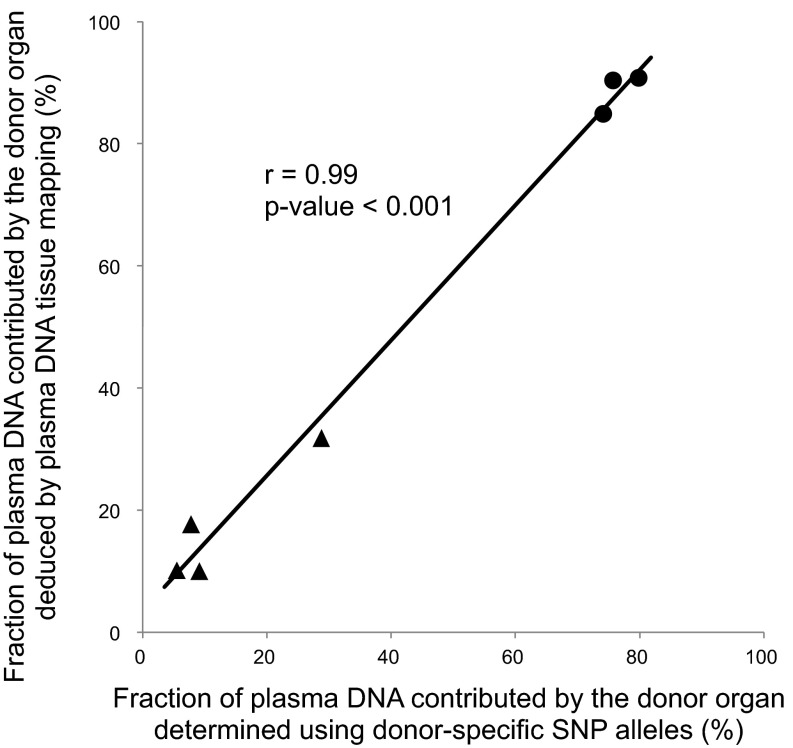
Fig. 6.
Correlation between the fractions of plasma DNA contributed by the transplanted graft deduced by plasma DNA tissue mapping and the donor DNA fractions determined using donor-specific SNP alleles. The triangles represent the results of liver transplant recipients and the dots represent the results of bone marrow transplant recipients.

