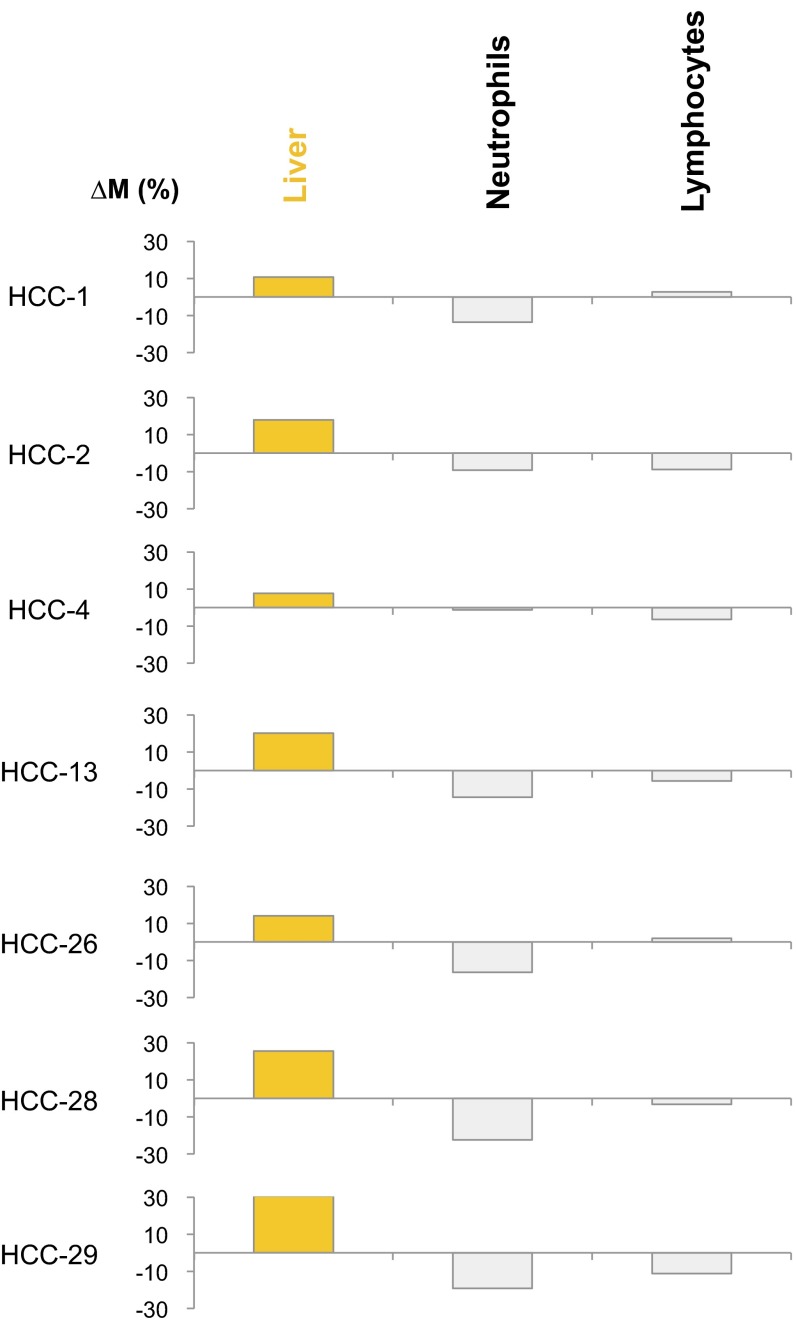
Fig. 11.
∆M values across different tissues for the HCC patients. ∆M represents the difference in the contributions of a particular tissue to plasma DNA between regions exhibiting copy number gains and copy number losses. For each case, the highest ∆M is shown in orange. Other ∆M values are shown in gray. The tissue with the highest ∆M is considered as the tissue of origin of the copy number aberration. HCC, hepatocellular carcinoma.

