Fig. 5.
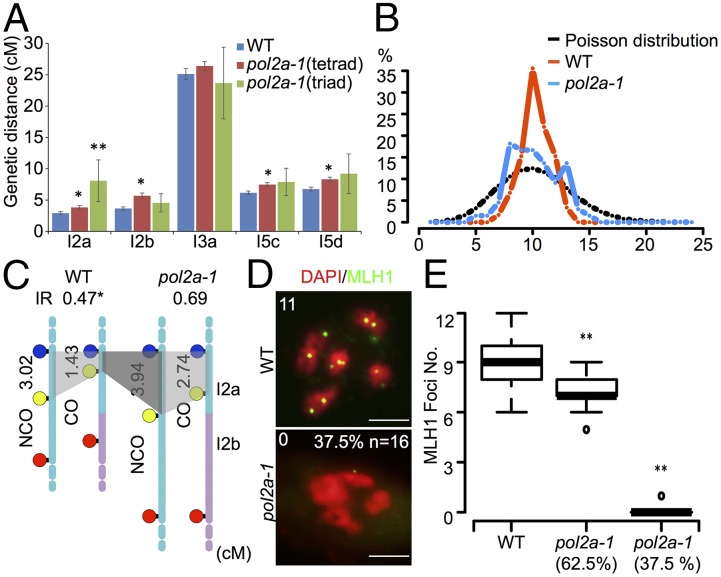
Estimation of meiotic recombination frequency and CO interference in pol2a. (A) Meiotic recombination frequency in five intervals from analyses of fluorescent tetrad or triad in the WT and pol2a-1. Positions of these intervals on chromosomes are indicated in SI Appendix, Fig. S9. Significant differences are shown by *P ≤ 0.05 and **P ≤ 0.01. (B) A graph of the chiasma frequency per nucleus in the WT and pol2a-1. Poisson distribution was based on 10,000 random samplings with an average of 10. (C) Genetic distance of interval I2a without or with CO in adjacent I2b in the WT and pol2a-1, respectively. Interference ratios are shown above with *P ≤ 0.05 against P(interference ratio = 1). (D) MLH1 foci (green) with DAPI (red) counterstain by immunostaining in the WT and pol2a-1. Numbers in the upper left indicate MLH1 foci numbers. (Scale bar: 5 μm.) (E) Statistics of MLH1 foci distribution in WT and pol2a-1 meiocytes. **P ≤ 0.01 with a one-tailed Student t test. IR, interference ratio.

