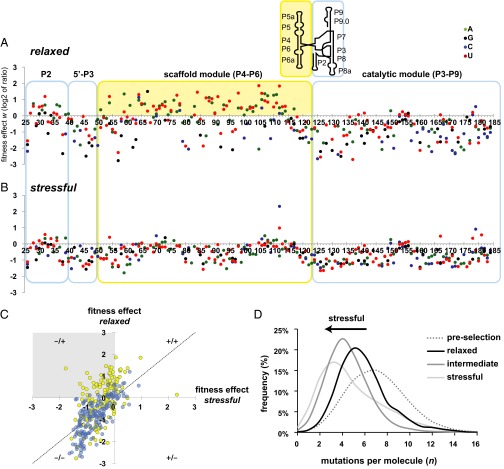
Fig. 2.
The individual and combined effects of mutations change with environmental perturbation. Each data point represents an individual mutation effect under relaxed (A) and stressful (B) conditions. The values on the horizontal axes show the nucleotide position in the ribozyme. The vertical axis shows the logarithmically (base 2) transformed ratio w of a mutation’s population frequency after selection, divided by the frequency before selection. Mutations that are enriched by selection lie above the vertical axis, and mutations that are purged lie below. The colored boxes delineate the modules of the structure. The solid yellow background highlights conditional mutations in the scaffold module that are frequently enriched in relaxed conditions (A) but are purged under stressful conditions (B). The Inset above shows a schematic representation of the secondary structure of the Azoarcus ribozyme, indicating the location of the modules in this context. (C) Scatterplot highlighting the modular location of conditional mutations. The gray quadrant highlights a region where the same mutation is enriched under relaxed conditions (25 mM MgCl2), but is purged or neutral under stressful conditions (2 mM MgCl2). For pairwise comparisons of all three conditions, see SI Appendix, Fig. S4. (D) Mutations per molecule were counted using sequence alignment to the wild-type ribozyme reference for populations surviving selection in the relaxed, intermediate, and stressful conditions, as well as for the preselection population. The histograms show the relative frequency (%) with which each number of mutations per molecule was observed in the samples from each population. The sample size for each condition are as follows: relaxed n = 3,369 reads, intermediate n = 26,143 reads, and stressful n = 12,204 reads.

