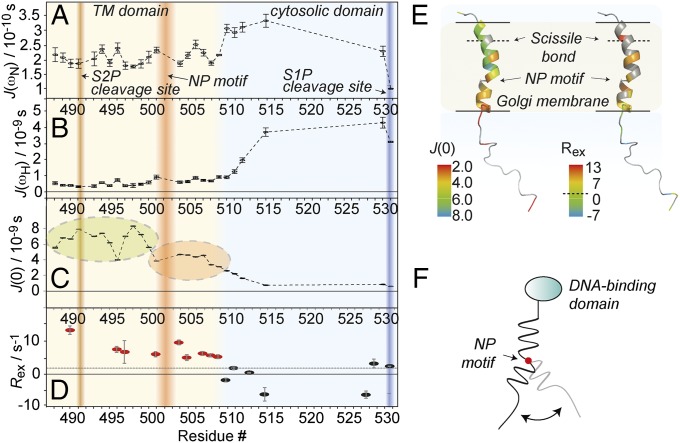
Fig. 3.
Backbone dynamics of the membrane anchor as processed by S1P. (A–C) Spectral density mapping [J(0), J(ωH), and J(ωN)] derived from 1H/15N hetNOE, transverse and longitudinal 15N autocorrelation rates R2 and R1, and transverse and longitudinal 1H/15N cross-relaxation rates ηz and ηxy data. Also see SI Appendix, Fig. S11. The S1P and S2P cleavage sites are marked by blue and brown shading, respectively; the NP motif is depicted in red. The background color of the plots denotes the position of the amino acids as membrane-imbedded (brown) or solvent-exposed (blue), according to Fig. 2. (D) Relaxation contributions from slow motion (μs to ns timescale motion). The dashed black line represents the average value. Residues with significant contributions from chemical exchange are depicted in red. (E) Model for the conformational flexibility derived from dynamics data, with the NP motif acting like a hinge. (F) Spectral density values at zero frequency (Left) and chemical-exchange contributions to R2 (Right) depicted on a membrane anchor topology model (see Molecular Dynamics for details) as expected in a membrane environment. Residues with increased fast motional amplitudes would be marked by lower J(0) values (orange to red colors). The same colorization was used to mark significant exchange contributions (yellow to red colors). The membrane boundaries (as derived from water NOEs in micelles) are marked by the black lines; gray residues mark those with incomplete datasets for the determination for each parameter due to unclear assignments, overlapping H/N signals, or insufficient signal-to-noise ratio. Determination of relaxation parameters involves only dispersed peaks in all experiments. In addition, the Ser and Thr-rich solvent-exposed terminus is largely exchange-broadened below detection in the T1 and T2 relaxation experiments. The dashed line in the color legend represents the average Rex throughout the protein.

