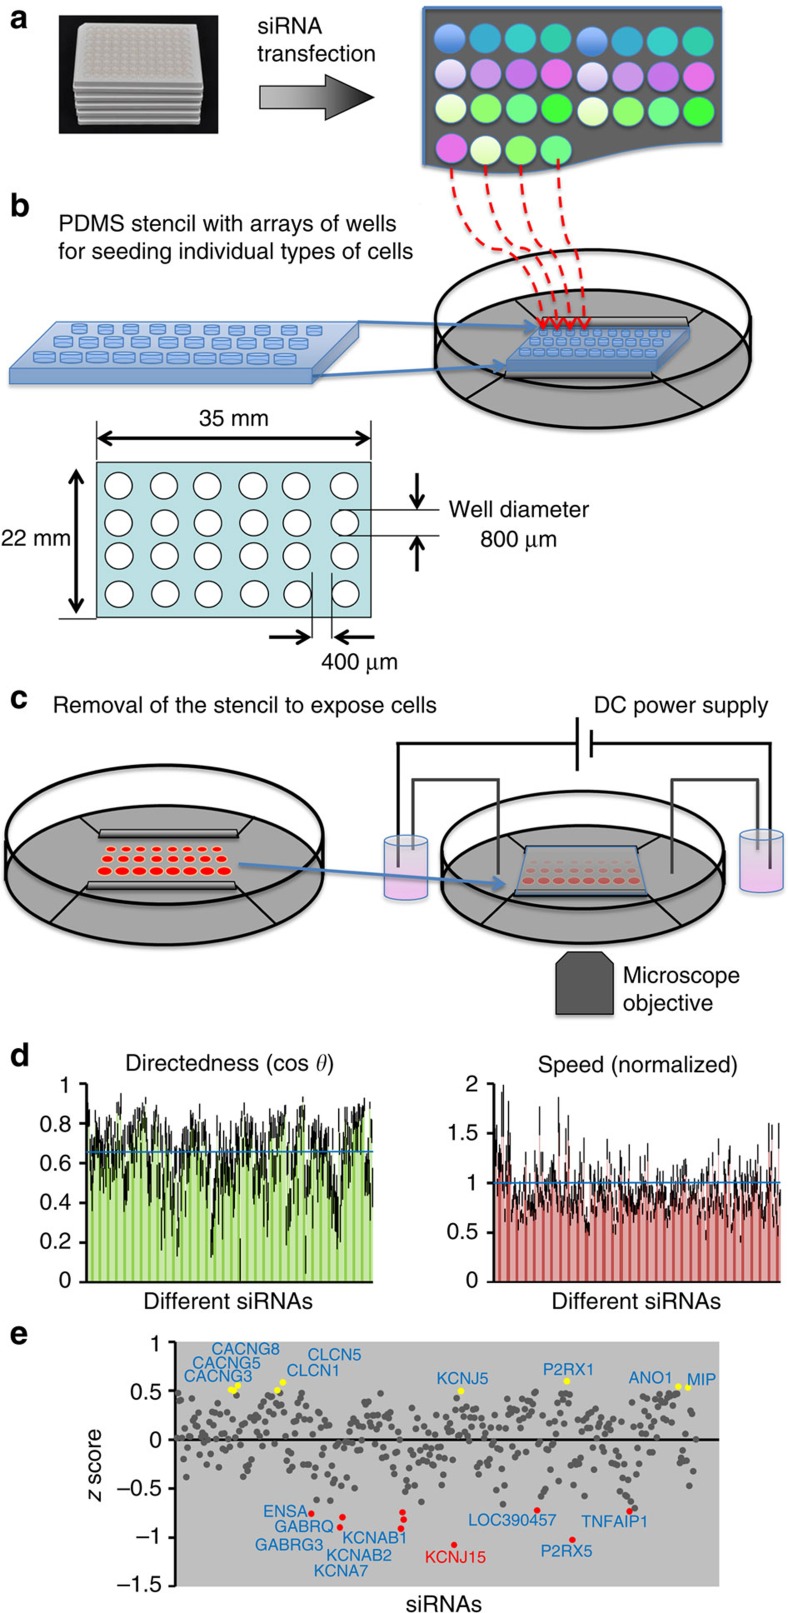
Figure 1. Large-scale RNAi screen for galvanotaxis phenotype.
(a) hTCEpi cells transfected with siRNA from a library against human ion channels/pumps/transporters. (b) Polydimethylsiloxane (PDMS) stencil facilitated cell spotting in the galvanotaxis chamber. Cells, 48 h after transfection, were spotted onto galvanotaxis/electrotaxis chamber, pre-coated with FNC coating mixture, which could be guided by the stencil. (c) Multi-field video imaging to efficiently record cell migration of many types of cells in one experiment. After cells adhered to the culture dish, the stencil was removed. The chamber was covered with a coverslip. Direct current was applied. Cell migration was imaged with a time-lapse imaging system. (d) Knockdown of channels with the RNAi library revealed genes important for galvanotaxis. Graphs show migration directedness (cos θ) and migration speed from first screening of the whole library. Control is indicated by the blue line (cos θ=0.64). Migration speed was normalized to paired control (=1, indicated by blue line). (e) The screen identified genes critical for galvanotaxis. The y axis represents the z score of directedness (cos θ). Genes with z score >0.495 are highlighted in yellow, representing genes that after knockdown significantly increased galvanotaxis. Genes with z score <−0.7 are highlighted in red, representing genes that after knockdown significantly inhibited galvanotaxis. Cell numbers analysed for each conditions 35–69. EF=200 mV mm−1.

