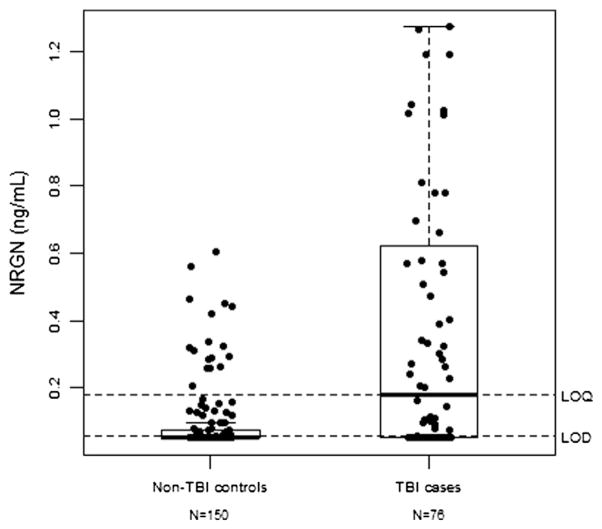
Fig. 3.
NRGN values among acute TBI cases and controls. This figure is a graphical representation of the distribution of neurogranin among TBI cases and non-TBI control subjects. Neurogranin values are higher in TBI cases than in non-TBI controls. The rectangle of the box plot represents the interquartile range (25th–75th percentiles) and the thick line within the box represents the median value of neurogranin. LOQ = limit of quantitation for neurogranin assay. LOD = limit of detection for neurogranin assay. Statistically significant difference between the control cohort and TBI cohort was observed, p < 0.0001.

