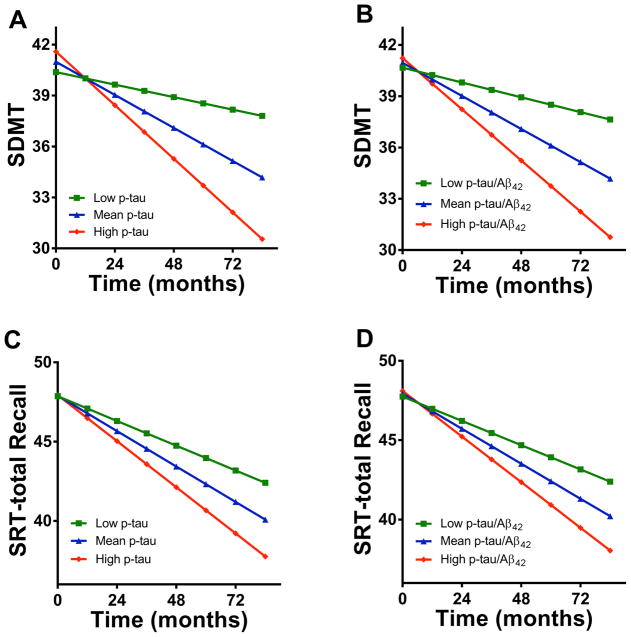
Figure 1. Change of predicted cognitive test scores over time in PD patients during Phase 2.
Data shown are the mean cognitive scores predicted from CSF biomarkers levels (low, mean, high) at the beginning of Phase 2 based on output from a mixed linear model; sex, education, and age at the beginning of Phase 2, final Phase 1 MMSE score, average UPDRS total and cognitive scores over 6 months prior to the beginning of Phase 2 were controlled as covariates. Blue lines indicate predicted cognitive scores by the mean levels of CSF biomarkers, green lines indicate predicted scores by low levels (mean – 1 SD) of CSF biomarkers, and red lines indicate predicted scores by high levels (mean + 1 SD) of CSF biomarkers. A: CSF p-tau vs SDMT, low p-tau can predict a 0.37/year decline of SDMT, mean p-tau can predict a decline of 0.97/year, high p-tau can predict a decline of 1.58/year; B: CSF p-tau/Aβ42 vs SDMT (low – 0.43/year, mean – 0.97/year, high – 1.50/year); C: CSF p-tau vs SRT-total Recall (low – 0.78/year, mean – 1.12/year, high – 1.45/year); D: CSF p-tau/Aβ42 vs. SRT-total Recall (low – 0.77/year, mean –1.10/year, high –1.44/year). SRT: Selective Reminding Test; SDMT: Symbol Digit Modalities Test

