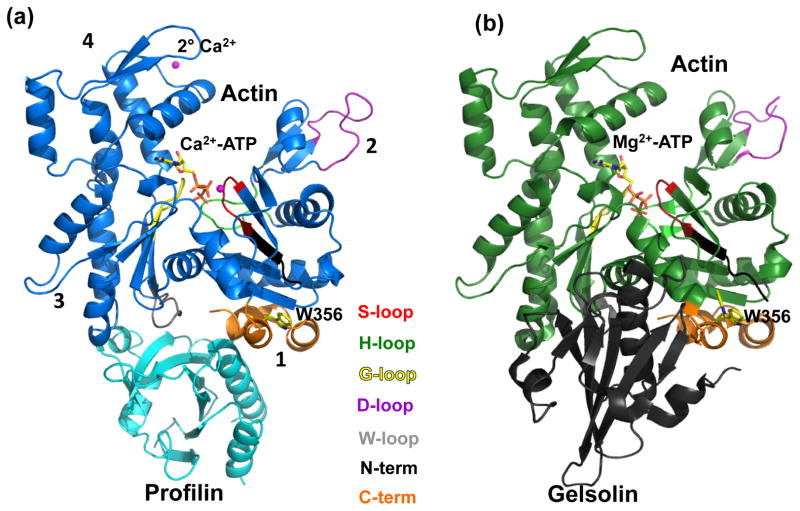
Figure 1.
Actin structure. (a) Wide-open state of bovine profilin-β:actin (PDB 3UB5). (b) Nonexchanging-closed state of gelsolin:pY53-actin. Subdomains 3 and 4 make up the large domain where Subdomans 1 and 2 make up the small domain. ATP is shown as sticks bound to Ca2+ (magenta sphere). Profilin (cyan) is bound to actin at subdomains 1 and 3. Gelsolin (grey) is bound to actin (green) at Subdomains 1 and 3. Actin loops are colored as follows: Sloop (residues 11 to 16) is red; H-loop (residues 70 to 78) is green; G-loop (residues 154-161) is yellow; D-loop (residues 38-52) is purple, W-loop (residues 165-172) is grey; N-terminus (residues 1-10) is black; and C-terminus (residues 349-375) is orange.

