Figure 3.
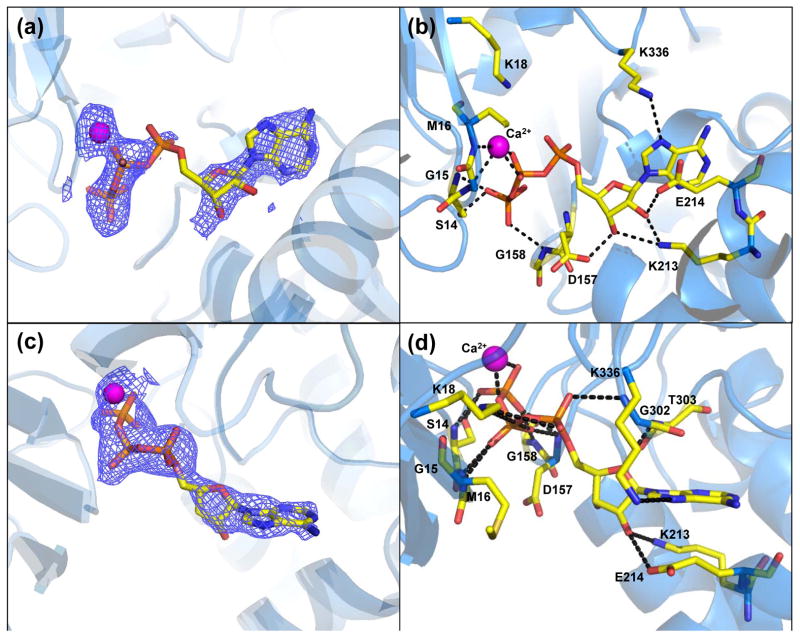
Profilin:actin nucleotide binding sites (a) Wide-open state omit FO-FC electron density map (2.5 σ). Most of the nucleotide has ordered density, but the α-phosphate is in a bent conformation, and lacks clear density. (b) Wide-open state ATP binding site. (c) Closed state omit FO-FC map (2.5 σ) showing continuous, well ordered density for the nucleotide and bound Ca2+. (d) Closed state ATP binding site. For parts (b) and (d) dashed lines represent hydrogen bonds.

