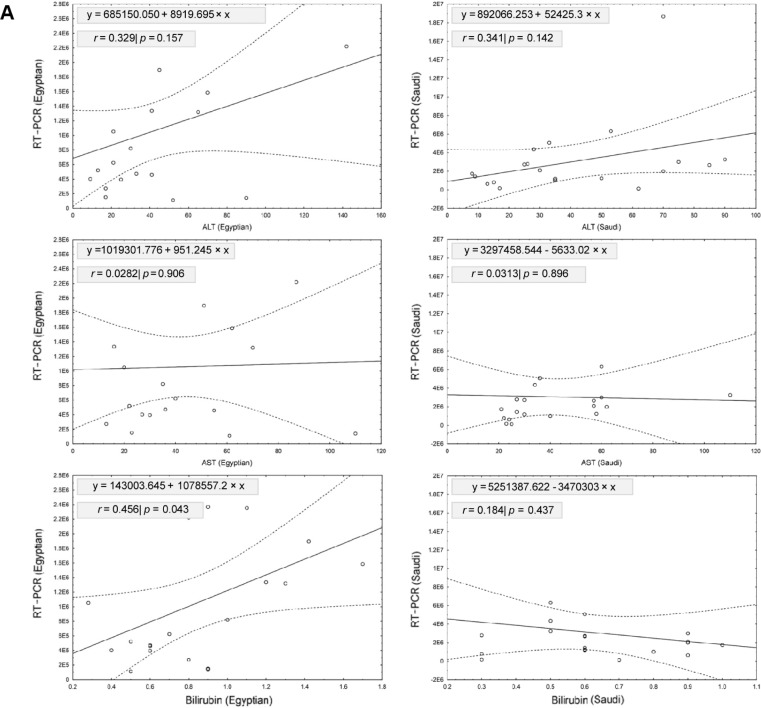
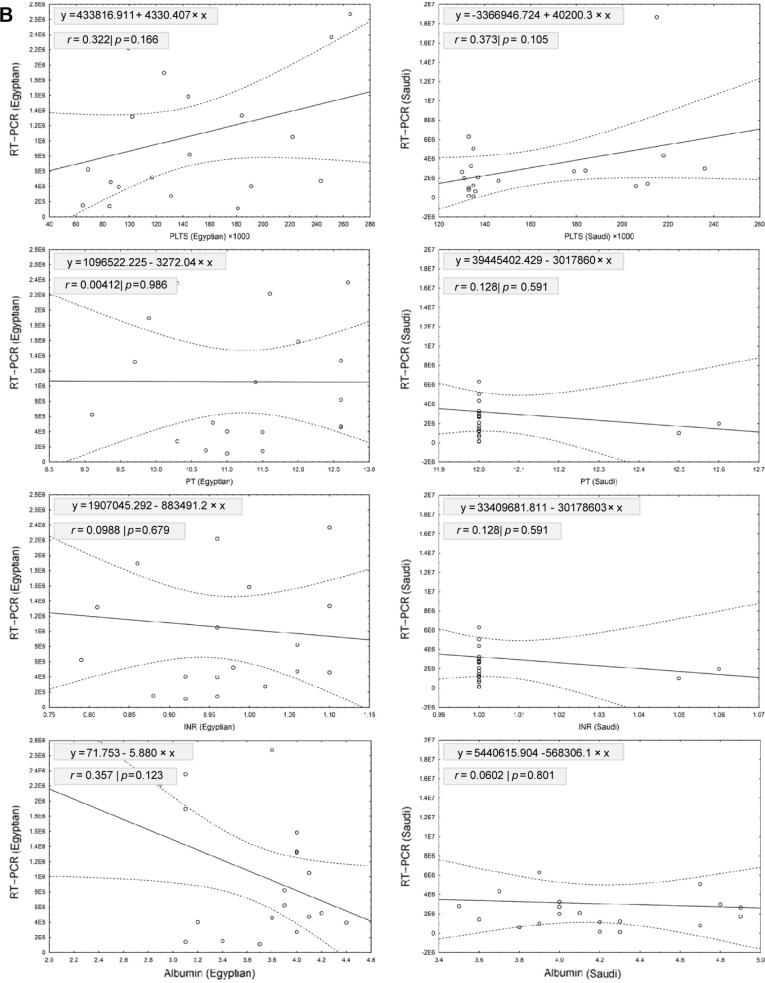
Figure 5.
The linear regression model for relationship between RT-PCR tested for HCV RNA viral load and different biochemical analyses for patients included in our study; these biochemical analyses are ALT, AST, bilirubin, PLTS, PT, INR, and albumin. (A) Shows the linear regression model for relationship between RT-PCR tested for HCV RNA viral load and different liver enzymes (ALT, AST, bilirubin). Our results showed that a significant positive relationship was detected between RT-PCR and bilirubin in Egyptian patients (r = 0.4560; slope = 1078557.2; P = 0.043). However, no significant relationships were detected between RT-PCR and ALT or AST from Egyptian and Saudi patients. (B) Shows the linear regression model for relationship between RT-PCR tested for HCV RNA viral load and different biochemical tests. Our results showed no significant relationships were detected between RT-PCR and these biochemical tests from Egyptian and Saudi patients. Scattered plots showed the relationship between RT-PCR and different clinical parameters for Egyptian (left) and Saudi (right) patients. Solid lines represent the linear regression with ±95% confidence intervals (dashed line).


