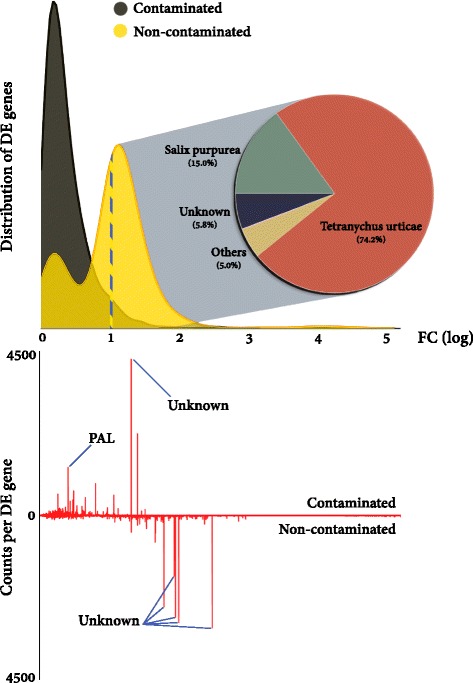
Fig. 4.

Differentially expressed gene distribution and abundance weighted fold change. Fold change (FC) distribution of DE genes (top) per treatment. The origin (organism) of genes with FC increases of >1 (log10) in non-contaminated trees is highlighted (dashed line and pie chart). Individual (normalised mean) transcript counts (fpkm) per differentially expressed gene (bottom) are segregated by fold change for a weighted view of differential expression. The higher of the two treatments is shown for each DE gene. Major peaks in abundance weighted FC are highlighted and labelled. PAL phenylalanine ammonia lyase. PPDE >=0.95
