
Figure. Change in performance for subcomponents of the QMG score.
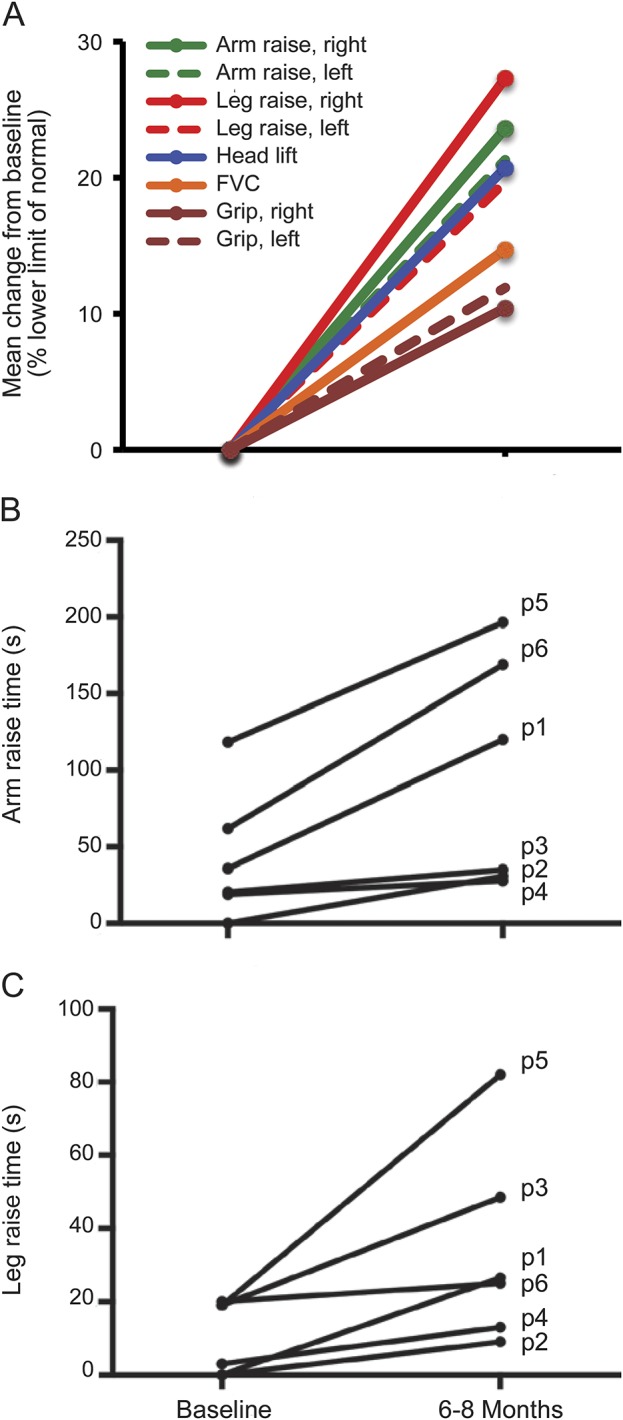
(A) Mean change in percentage of the lower limit of normal (minimum required to achieve 0 in the QMG scale). Times for individual patients for arm raise at 90° (B) and leg raise at 45° (C). Data points are the mean of right- and left-side scores. The mean values at 6 to 8 months were significantly increased in both arm raise (p = 0.028; Wilcoxon signed rank test) and leg raise (p = 0.028; Wilcoxon signed rank test) compared with baseline. FVC = forced vital capacity; p(n) = patient number; QMG = quantitative myasthenia gravis.