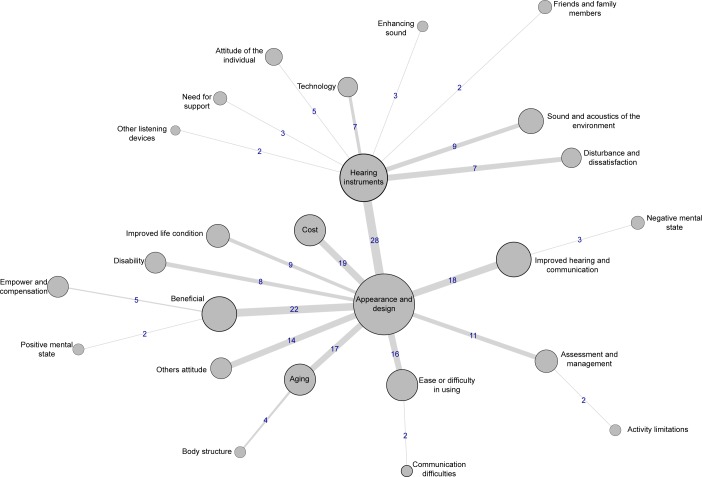
Figure 6.
Co-occurrence analysis index for the United Kingdom, showing the main categories related to hearing aids and their associations with each other (n=100).
Notes: The size of the node is proportional to frequency; the thickness of the line (and the number) indicates strength of the connection between those categories.

