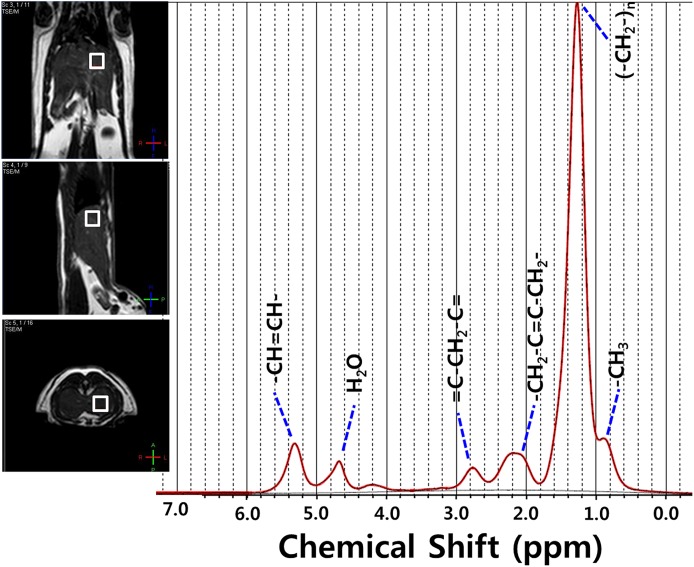
Fig 1. In-vivo MRS analysis.
Typical liver 1H proton magnetic resonance spectroscopy spectra at week 8 after the start of the high-fat diet administration, with typical voxel (0.8×0.8×0.8 cm3) placement, were shown in the T2-weighed axial, sagittal and coronal turbo spin images. The water (H2O) and 4.7 ppm signals were effectively suppressed in the spectra.

