
FIGURE 1.
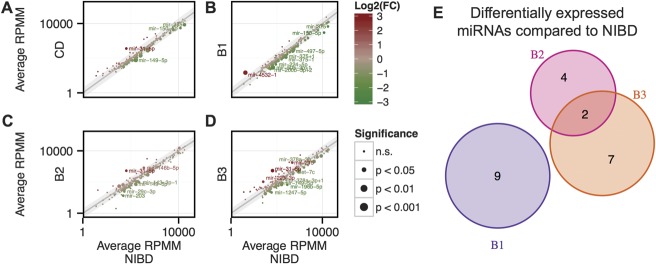
Scatter plots showing average miRNA expression as determined by small RNA-sequencing comparing (A) CD, (B) B2/nonstricturing, nonpenetrating class, (C) B2/stricturing class, and (D) B3/penetrating class with NIBD patient samples. (E), Venn diagram showing overlap of significantly DE microRNAs relative to NIBD. Gray shaded region indicates log2(FC) < 1 or > −1. Size of point indicates significance level as determined by a 2-tailed unpaired Student's t test, whereas color indicates direction of change. miRNAs achieving significance and log2(FC) of > 1 or < −1 change in expression are labeled and considered DE.