
FIGURE 3.
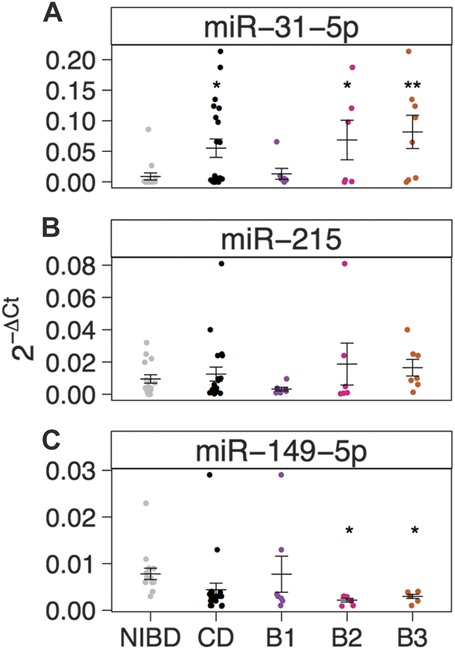
Relative miRNA expression levels (2−ΔCt) as determined by qRT-PCR and normalized to RNU48 are shown for (A) miR-31-5p, (B) miR-215, and (C) miR-149-5p in NIBD (n = 15, gray) and CD (n = 20, black) patient samples. CD samples are further categorized as B1 (purple, n = 7), B2 (pink, n = 6), or B3 (orange, n = 7). Mean and SE for each group are depicted using horizontal and vertical bars. Significance is determined using a 2-tailed unpaired Student's t test comparing each group with NIBD samples. *P < 0.05, **P < 0.01.