
FIGURE 4.
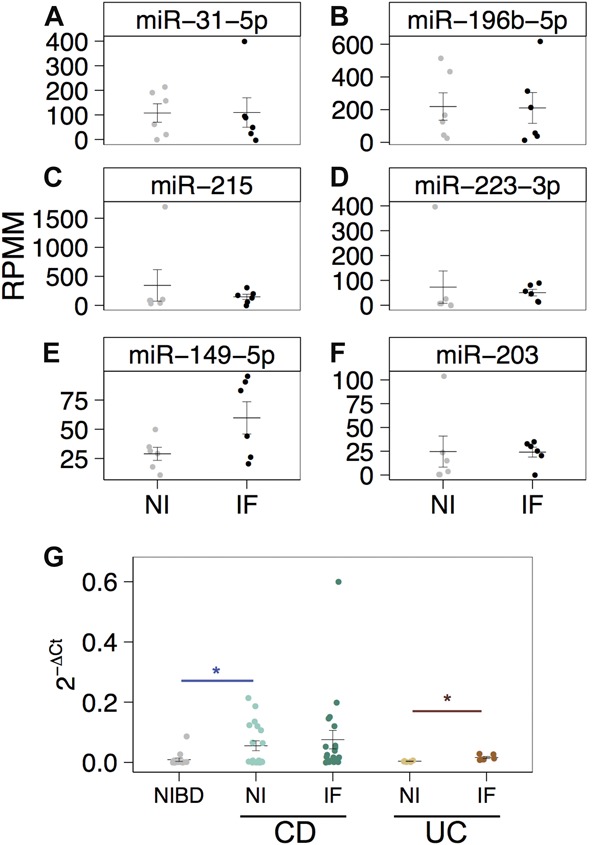
miRNA expression (reads per million mapped) as determined by small RNA-sequencing is shown for (A) miR-31-5p, (B) miR-196b-5p, (C) miR-215, (D) miR-223-3p, (E) miR-149-5p, and (F) miR-203 in 6 matched noninflamed (NI; gray) and inflamed CD samples (IF; black) patient samples. (G), Relative miR-31-5p expression levels (2−ΔCt) as determined by qRT-PCR and normalized to RNU48 are shown for samples from NIBD patients (n = 15), matched NI and IF patients with CD (n = 19), and matched NI and IF UC patient samples (n = 6). Significance is determined using a 2-tailed unpaired Student's t test comparing each group with NIBD (blue with bar) samples or matched noninflamed tissue (red with bar). *P < 0.05. Significance was not achieved by a 2-tailed paired Student's t test comparing NI with IF in panels (A–F).