
FIGURE 5.
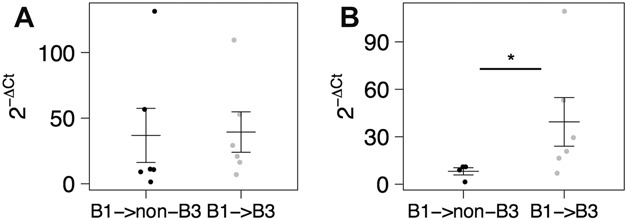
Relative miR-215 expression levels (2−ΔCt) as determined by qRT-PCR and normalized to RNU48 for B1 patient samples that (A) either progressed to a non-B3/penetrating disease (B1 → non-B3, n = 6, black) or progressed to B3/penetrating disease (B1 → B3, n = 6, gray). B, Samples from (B) were subcategorized to include only B1 samples from patients with active CD that did not progress to B3/penetrating disease (B1 → non-B3, n = 4) or progressed to B3/penetrating disease (n = 6). Mean and SE for each group are depicted using horizontal and vertical bars. Significance determined using a one-tailed, unpaired, and unequal variance Student's t test comparing each group with B1 → non-B3 samples. *P < 0.05.