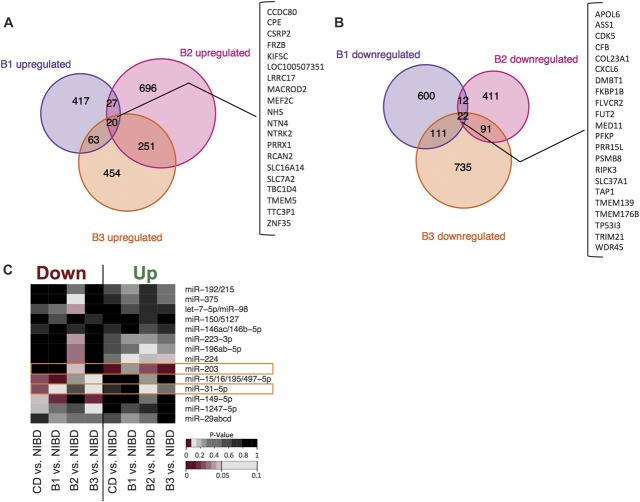
FIGURE 6.
Venn diagram showing the number of DE genes (P < 0.05) that were (A) upregulated or (B) downregulated compared with NIBD controls in each of the CD subclasses. Genes that were significantly upregulated or downregulated in all 3 classes, respectively, are shown on the right in the bracketed table. C, Enrichment analysis for target sites of expressed miRNAs (reads per million mapped >100) in DE genes as determined by RNA-sequencing. On the x-axis, DE gene lists were divided into upregulated and downregulated genes for 4 comparisons: CD versus NIBD, B1 versus NIBD, B2 versus NIBD, or B3 versus NIBD. P-values <0.05 are shown in shades of red.

