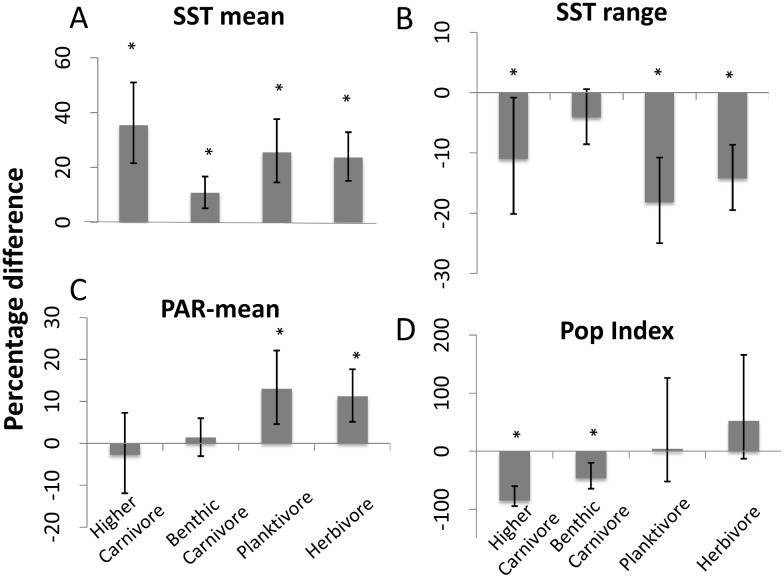
Fig 2. Percentage difference in biomass (± 95% confidence intervals) for covariates investigated.
Percentage difference in biomass per 1°C change in mean sea surface temperature (A), 1°C change in the annual range in sea surface temperature (B), 1 Einstein/m2/day change in annual mean photosynthetically-active radiation (C), and a single unit increase in the index of local population density (D) for each of the four trophic groups. Ratios were obtained from the β coefficients and transformed into % increment in biomass, by 100*(exp(β)-1). Asterisks denote statistically significant difference (p<0.05).

