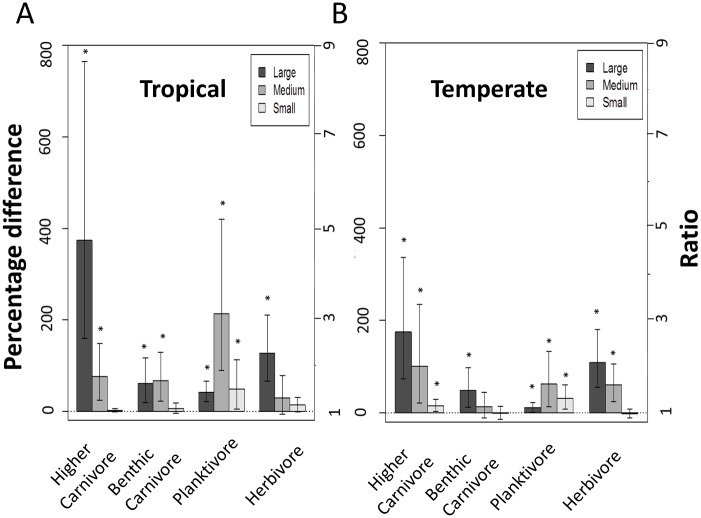
Fig 4. Percentage difference in biomass of the different trophic groups size categories in temperate and tropical areas.
Log ratios of fish biomass (log(biomassMPA/biomassOPEN)) between trophic and body size groups in effective MPAs in temperate (A) and tropical (B) regions, relative to open access zones (± 95% confidence intervals). Small fishes <7.5 cm; medium fishes from 7.5 to 30 cm; large fishes >30 cm. Ratios were obtained from the coefficient for Protection, β 5, and transformed into percentage increments in biomass, by 100*(exp(β 5)-1). Asterisks denote a statistically significant difference (p<0.05). The model also adjusted for SST mean, SST range, PAR-mean and human population.

