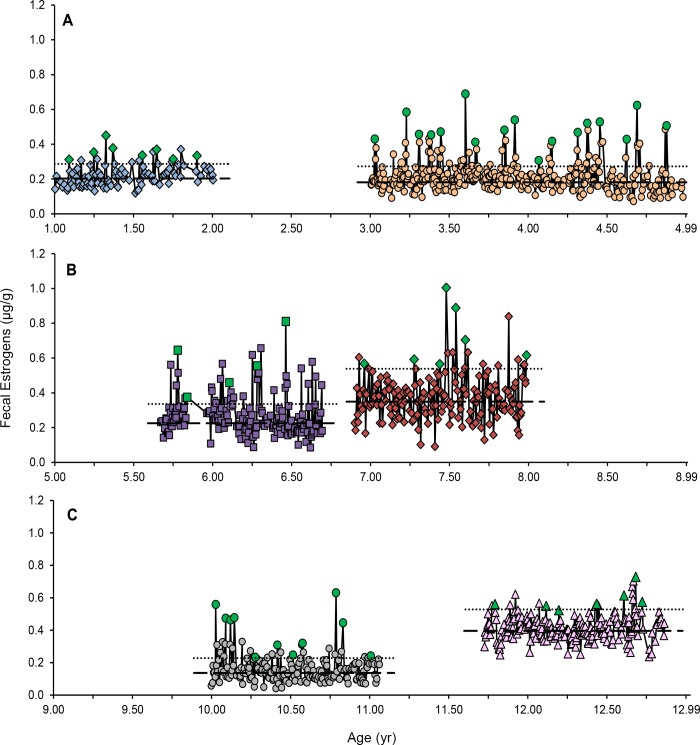
Fig 1. Fecal estrogen metabolite (μg/g) profiles of six females of diverse ages.
Panel A: SB408, blue diamonds and SB247, orange circles; Panel B: SB205, purple squares and SB235, red diamonds; Panel C: SB140, grey circles and SB76, pink triangles. Baseline (dashed line) and threshold (dotted line) concentrations were calculated for each female. Estrous peaks are denoted with green data points.

