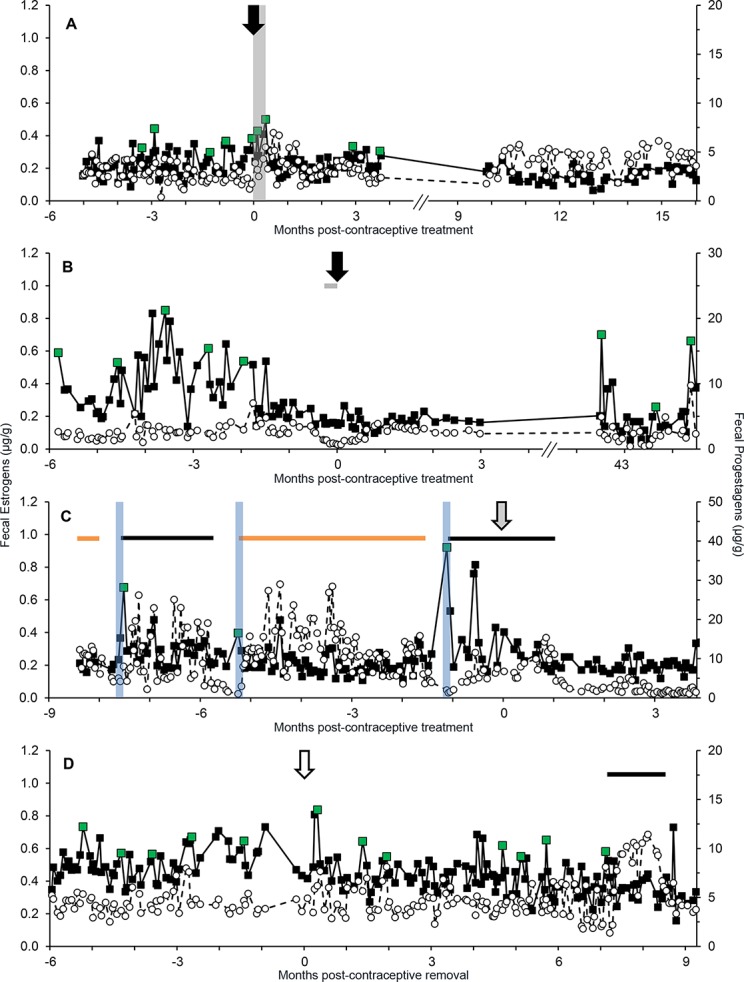
Fig 5. Reproductive steroid hormone profiles (μg/g feces, FEM: filled squares, FPM: open circles, dashed line) before and after Suprelorin or MGA treatment and before and after MGA removal.

Suprelorin treatment indicated with black arrows in panel A (SB244) and panel B (SB341), MGA treatment represented with a grey arrow in panel C (SB124) and MGA removal denoted with an open arrow in panel D (SB224). Green data points indicate estrous peaks, vertical blue bars correspond with breeding, black horizontal bars represent non-pregnant luteal phases and orange horizontal bars signify pregnancies. In panel A, the vertical grey bar shows a 9 d contraception-induced estrous event. In panel B, the horizontal grey bar denotes a 14 d oral megestrol acetate (MA) treatment prior to Suprelorin placement.
