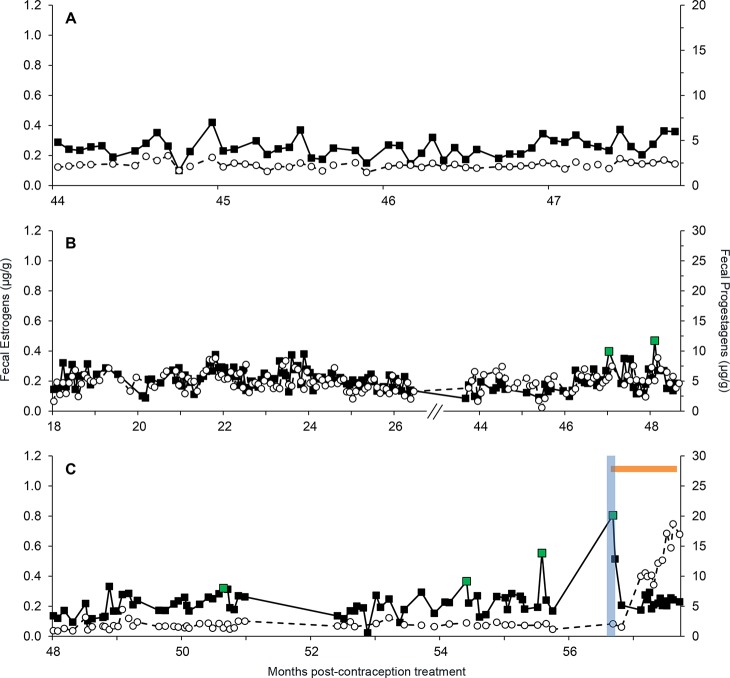
Fig 6. Fecal steroid hormone profiles (μg/g, FEM: filled squares, FPM: open circles) for three females contracepted with Suprelorin.
Panel A (SB200), Panel B (SB283), Panel C (SB218). Baseline and threshold estrogen concentrations are denoted by dashed and dotted lines, respectively. Green data points, a blue vertical bar and an orange horizontal bar indicate estrous peaks, breeding and pregnancy, respectively.

