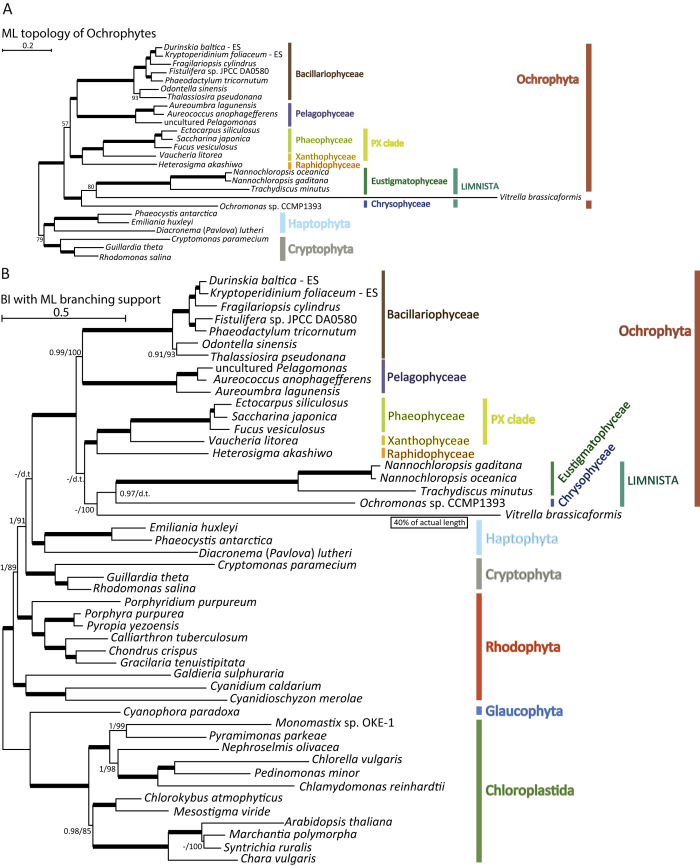
Figure 2. The phylogenetic position of the Vitrella brassicaformis plastid.
The trees were inferred from a concatenated matrix of 34 slowly-evolving conserved plastid genes (dataset SG, 14,699 aa positions) excluding the rapidly evolving genome of Karlodinium veneficum. (A) Maximum-likelihood tree (RAxML, GTRGAMMA model); only the “chromalveolate” subtree is shown for simplicity. (B) PhyloBayes tree inferred using the CAT-GTR model. The convention for indicating branch support values is the same as in Fig. 1.

