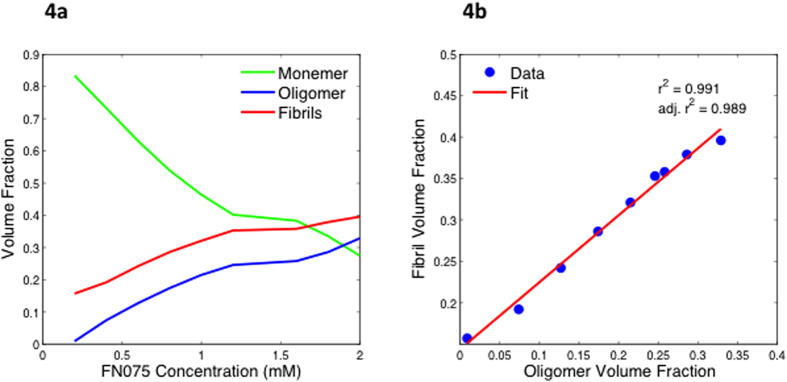
Figure 4.

Volume fractions from the decomposition of the titration series. a) Plot of the volume fractions as function of FN075 concentration, revealing the development in solution of monomers (green), fibrils (red) and oligomers (blue). Notice the constant relationship between the amount of fibrils and oligomers throughout the series. A similar investigation of the development over time while keeping the ratio constant is included in supplementary information. b) Linear regression of the fibril volume fraction as a function of oligomer fraction. Notice the high correlation coefficient.
