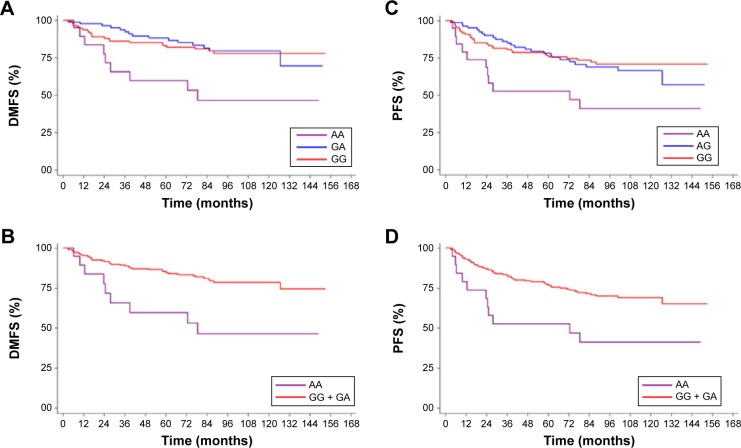
Figure 2.
Kaplan–Meier curves of DMFS and PFS for the different CXCL12 rs1801157 genotypes.
Notes: (A and C) Compare GG, GA, and AA genotypes for DMFS and PFS. (B and D) Compare GA + GG and AA genotypes for DMFS and PFS. P-value was calculated by log-rank test.
Abbreviations: CXCL12, chemokine ligand 12; DMFS, distant metastasis-free survival; PFS, progression-free survival.

