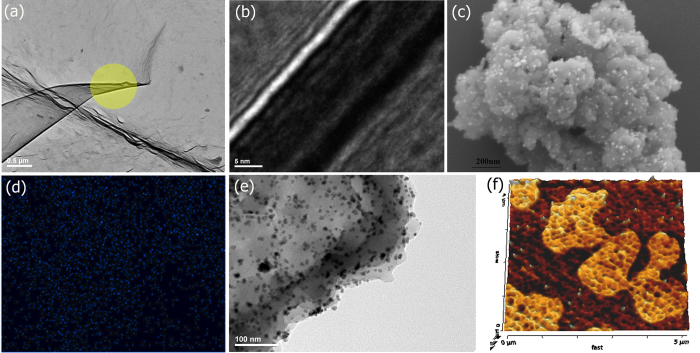
Figure 3.
(a) HR-TEM image of the as-synthesized trzn-COF showing the transparent layers formed by the COF and a fold can be seen at the region where the layer wraps-up. The yellow circled region has been zoomed in the adjacent figure. (b) A zoom-in using HRTEM on the folds of the COF layers (yellow circle, Fig. 3a) showing the grid like appearance within and the flaky appearance between the trzn-COF layers (c) Field emission SEM of Pd-trzn-COF showing the uniform morphology of the COF, and the homogeneous loading of Pd0. (d) the elemental mapping of Pd0 showing its uniform distribution across the COF surface. (e) a high resolution TEM image of the Pd-trzn-COF showing the presence of small nanoparticles of Pd0 (<5 to 20 nm) on the surface of the COF. (f) A 3D AFM image showing the ordered patterns formed by the trzn-COF (relative heights, dark brown: 0nm; light brown = 20nm).

