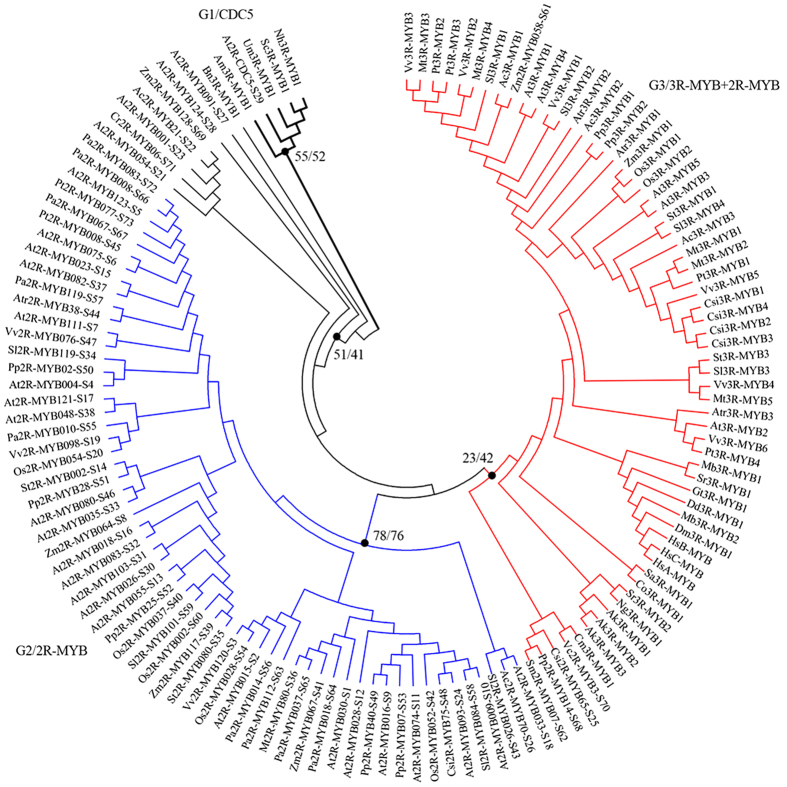
Figure 7. A ML tree of the R2 and R3 MYB repeats of the representatives of 2R-MYB and 3R-MYB proteins.
The maximum likelihood (ML) tree represents relationships among 73 representatives of 2R-MYBs and 63 eukaryotes 3R-MYBs. Numbers beside the branches represent bootstrap support values (>50%) from 100 replications in the ML analysis and 1000 replications in the Neighbor-joining (NJ) analysis.

