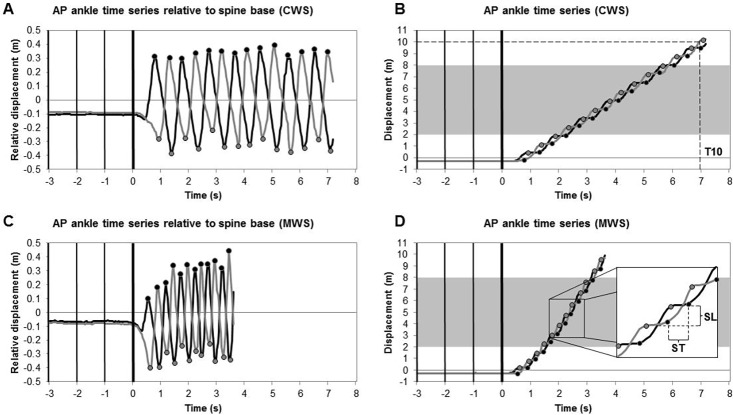
Fig 4. Overview of the analysis of spatiotemporal gait parameters.
Analyses for CWS (panels A and B) and MWS (panels C and D) conditions are based on AP displacement data of the right (gray lines) and left (black lines) ankles as a function of time for the multi-Kinect v2 set-up. AP ankle time series relative to the spine base (panels A and C) were used to estimate instants of foot contact (black dots) and foot off (gray dots) for each step. Step location was defined as the median value of the AP ankle time series during the single-support stance phase (i.e., the horizontal plateaus delimited by foot off and foot contact events of the contralateral foot in panels B and D). Vertical bars represent the four beep onsets of the auditory start command. The shaded area in panels B and D represent the 6-meter window from which spatiotemporal gait parameters were derived. Dashed lines in panels B and D schematically define the time to walk 10 meters (T10), step time (ST) and step length (SL).

