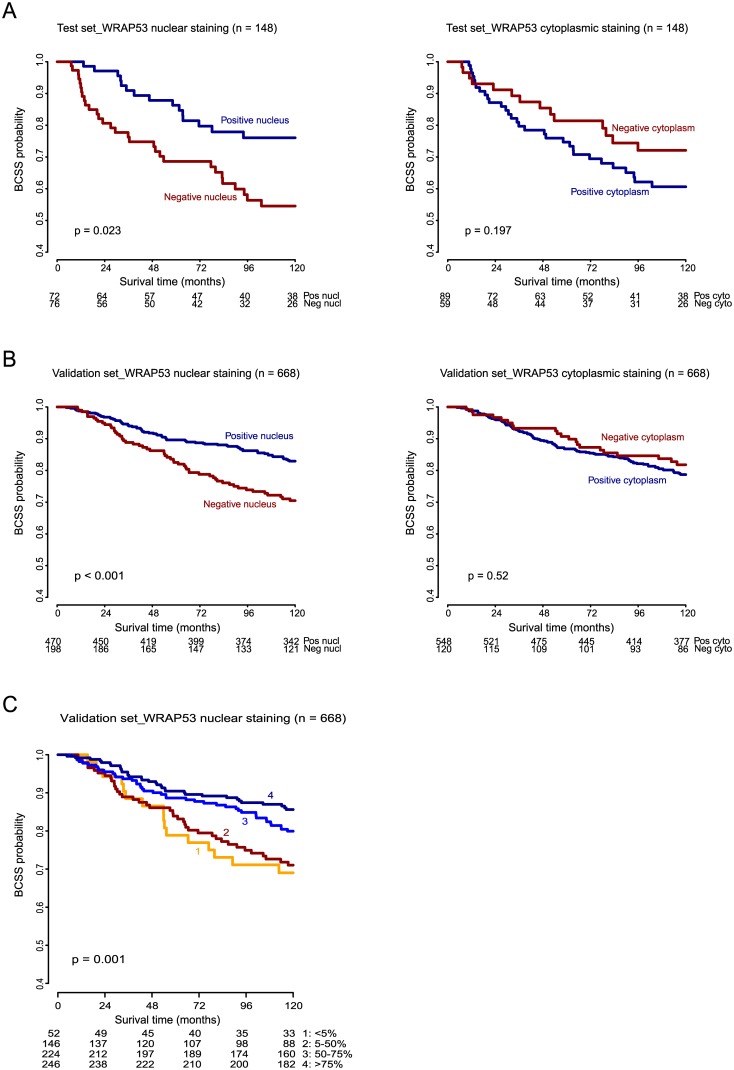
Fig 2.
Kaplan-Meier curves showing Breast Cancer Specific Survival (BCSS) of WRAP53 IHC staining of nucleus and cytoplasm A. in the test set and B. in the validation set. C. BCSS of WRAP53 nuclear IHC staining in validation set categorized based on fraction of stained cells. 0: no tumor cells with distinct staining of the nucleus, 1: <5% of the cells stained, 2: 5–50% of the cells stained, 3: 50–75% of the cells stained, and 4: >75% of the cells stained. Numbers at risk are listed below each chart.

