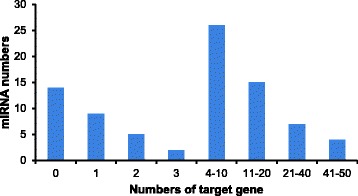
Fig. 5.

The distribution of target gene numbers for differentially expressed miRNAs among banana ripening process. The differentially expressed miRNAs of ethylene/1-MCP and their targeted genes are analyzed in this figure. The X-axis represents the interval for the target gene number of each miRNA. The Y-axis represents the number of miRNA in each interval
