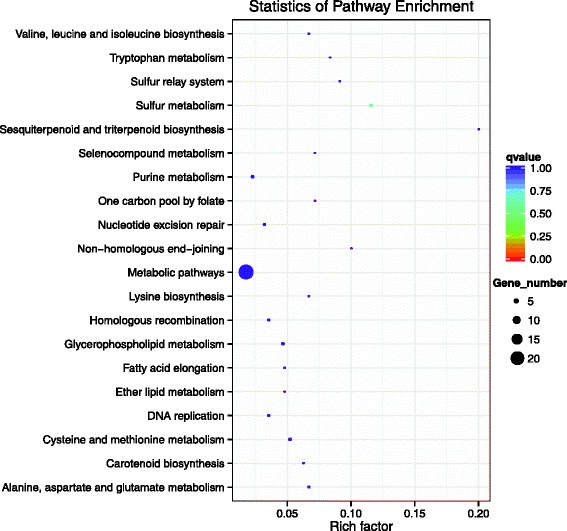
Fig. 7.

KEGG analysis of the 20 most enriched pathways. The coloring of the q-values indicates the significance of the rich factor. The circle indicates the target genes that are involved, and the size is proportional to the gene numbers. The x-axis represents name of enrichment pathway. The Y-axis represents rich factor
