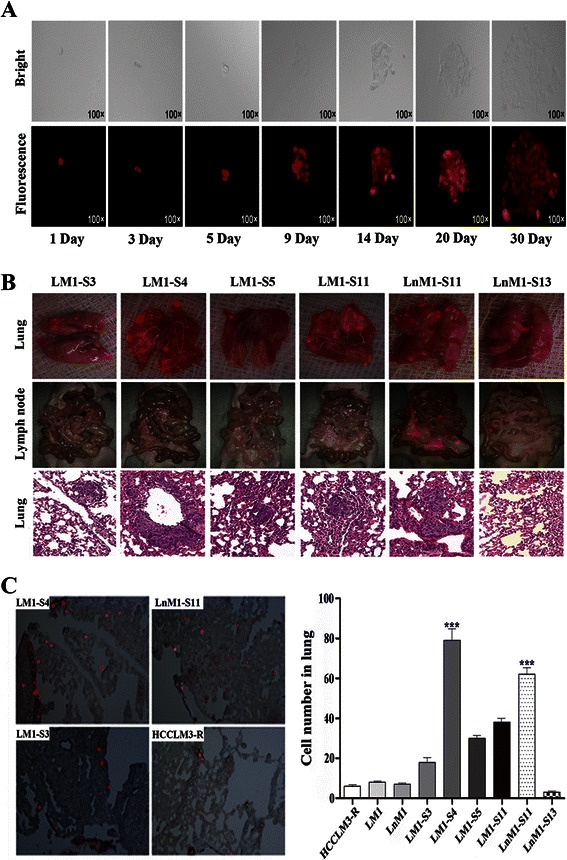
Fig. 2.

Metastatic tropisms and lung colonizing abilities of monoclonal HCC cell lines. a Representative images of the screening processes of monoclonal cell line under bright field (top) and red fluorescence field (bottom, ×100). b Metastatic foci in lung (top, ×1.25) and celiac lymph node (middle, ×0.63) visualized via fluorescence microscope; lung metastasis (bottom, ×200) verified in H&E-stained sections. c Lung colonies of monoclonal HCC cells in the recipient mice at 72 h after tail vein injection (left); Quantification of colonizing cells in frozen sections of lung (right). Data are presented as mean ± SEM, Kruskal-Wallis was used
