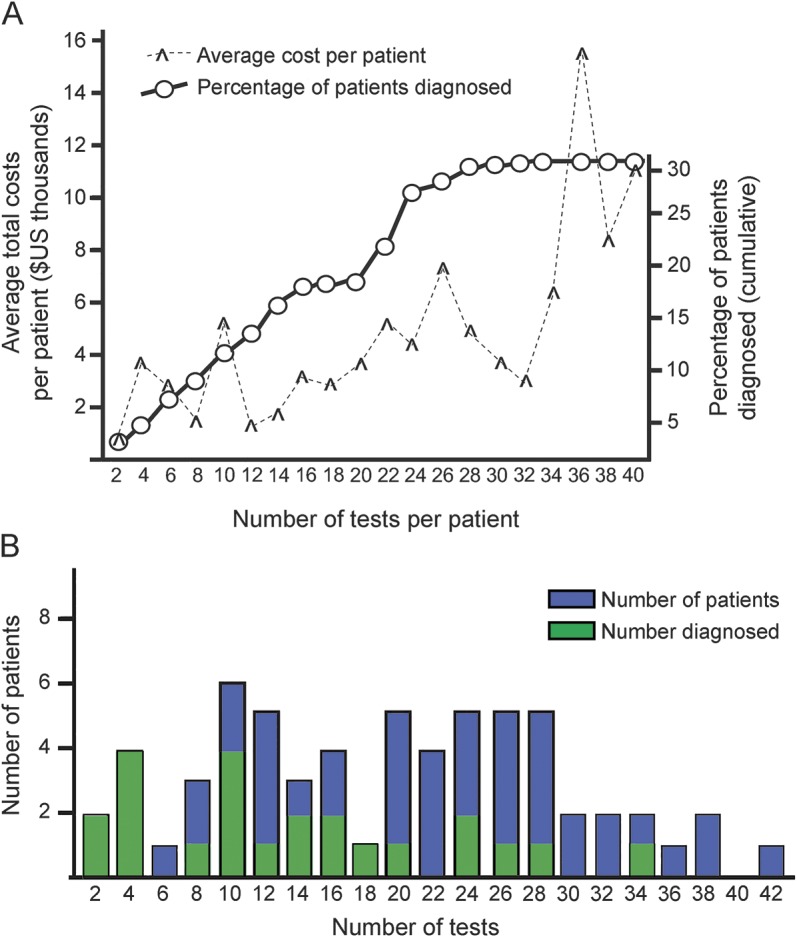
Figure. Costs, testing, and diagnosis in the diagnostic odyssey.

(A) Average costs per patient based on number of tests ordered (hash), arranged by number of tests obtained (x-axis), and cumulative percentage of patients diagnosed (circles). (B) Number of patients (y-axis) viewed by number of tests obtained (x-axis); green bar indicates number of patients with a final diagnosis.
