
Fig. 4.
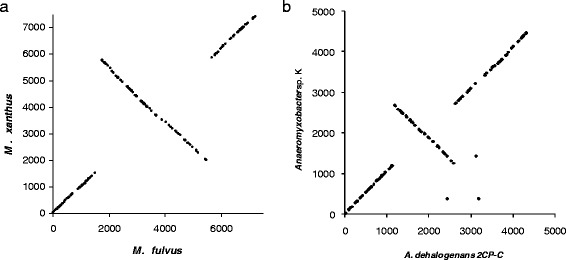
Dot-plots of TCS gene orthologues. Orthologues are plotted according to their genomic location (as inferred from the consecutive numbering of their locus tags) in both genomes. Each genome starts at the origin, with the dnaA gene being the first gene. A central line of orthologues extending from top left to bottom right indicates an inversion of a large section of the chromosome, centered around the origin/terminus. a Dot-plot of Mx/Mf TCS gene orthologues. b Dot-plot of AdC/AK orthologues