Fig. 2.

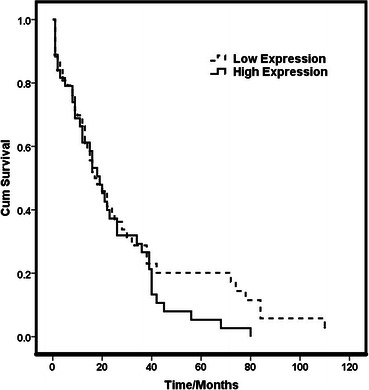
Disease free survival curve (Kaplan-Meier Curve) showing the survival probabilities of low and high immunoexpression groups of c-MET (log-rank = 1.142, p = 0.285)

Disease free survival curve (Kaplan-Meier Curve) showing the survival probabilities of low and high immunoexpression groups of c-MET (log-rank = 1.142, p = 0.285)