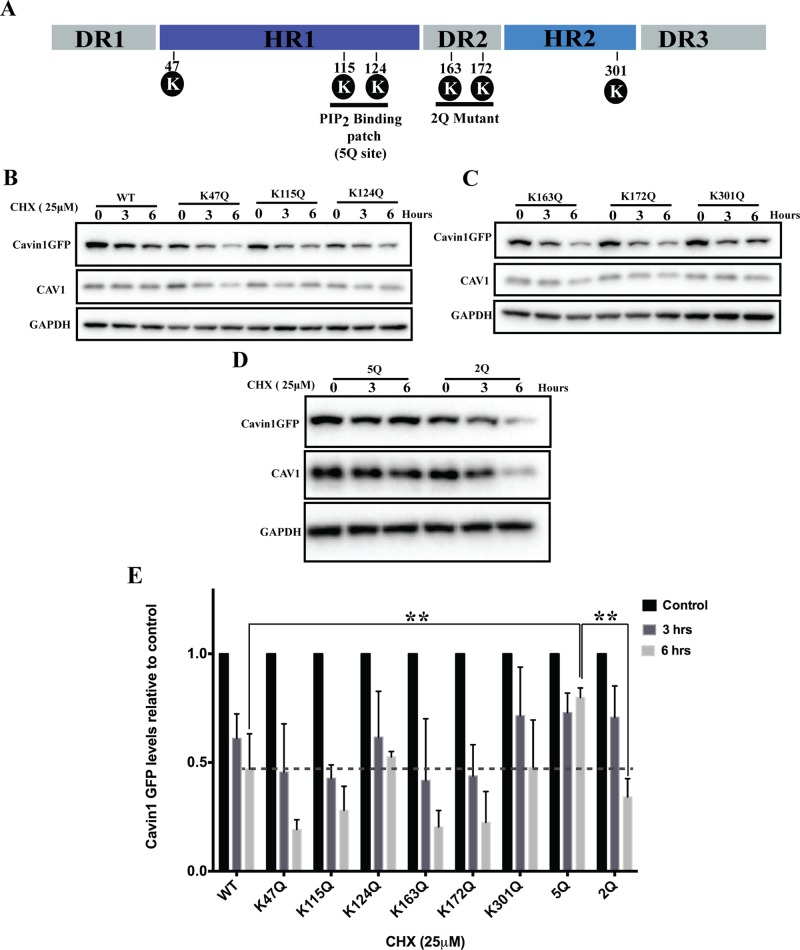
FIGURE 2:
Mapping the major ubiquitylation site in cavin1. (A) Schematic representation of cavin1 structural domains (Kovtun et al., 2014), PI(4,5)P2-binding site shown as 5Q, and the position of putative lysine residues chosen for protein turnover study encompassing the 5Q site. (B–D) CHX chase assay for cavin1 point mutants shown in A and respective immunoblot analysis for GFP, CAV1, and GAPDH. (E) Quantification of Western blots for cavin1-GFP levels from two (point mutants) or three to four (WT and 5Q cavin1-GFP) independent experiments normalized to control (untreated samples) for each mutant. Data are presented as mean ± SD. **, p < 0.01. Representative uncropped immunoblots are shown in Supplemental Figure S2. Western blot images shown in Figures 2B and 4C (WT cavin1-GFP turnover upon overexpression in PC3 line) originate from different replicates, but quantifications shown in Figures 2E and 4D are the same.

