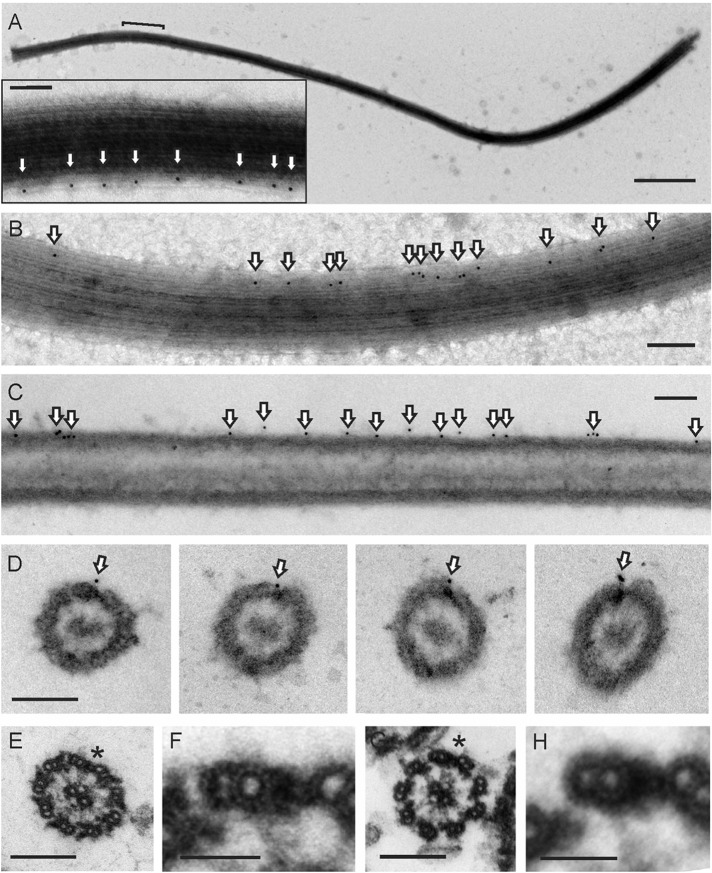
FIGURE 5:
ODA10 is restricted to DM1. (A, B) Negative-stain electron micrograph of ODA10HA localized with 10-nm gold particles (arrows) on unfixed axonemes. Bracket in A indicates the region enlarged in the inset. (C, D) Pre-embedding, labeled oda10,ODA10HA axonemes, thin section. (E) Wild-type axoneme (proximal). (F) Enlarged averaged view of wild- type DM1–DM2 bridge. (G) oda10 axoneme (proximal). (H) Enlarged averaged view of oda10 DM1–DM2 bridge. The DM1–DM2 bridge is marked by an asterisk in E and G. Scale bar, 1 μm (A; inset, 100 nm); 200 nm (B–E, G), 50 nm (F, H).

