
Fig. 3.
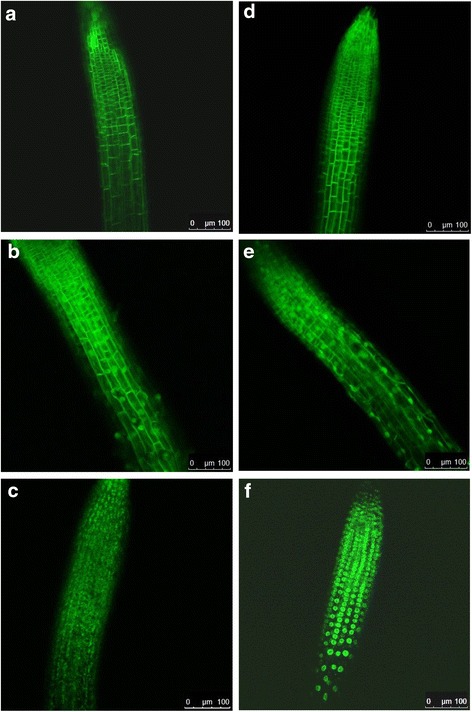
Fluorescent confocal images of transgenic plant roots expressing plasma membrane and nuclear membrane-localized GEVIs and derivatives. Images show the area of the root tip (meristem) and adjacent transition zone. The white bars on the bottom right indicate 100 μm. a ArcLight; b WPP-ArcLight; c SUN2-ArcLight; d CBL1-SEpHluorinA227D; e WPP-SEpHluorinA277D; f SUN2-SEpHluorinA277D. The letters correspond to those in the diagrams and constructs in Figs. 1 and 2, respectively