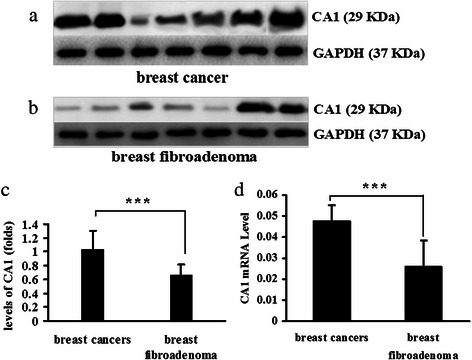
Fig. 1.

CA1 expression in breast cancer and breast fibroadenoma. a Visualisation of CA1 expression and GAPDH expression in breast cancer tissues using western blot analysis. b Visualisation of CA1 expression and GAPDH expression in breast fibroadenoma using western blot analysis. c For quantification purposes, the level of CA1 protein expression was normalised against GAPDH expression in each of the tissues. d Quantifying the expression of CA1 mRNA in breast cancer tissue and breast fibroadenoma using real-time PCR; CA1 expression was normalised against GAPDH expression in each of the tissues. The expression levels are depicted as the means ± SEMs. * indicates p < 0.05, ** indicates p < 0.01, *** indicates p < 0.001
