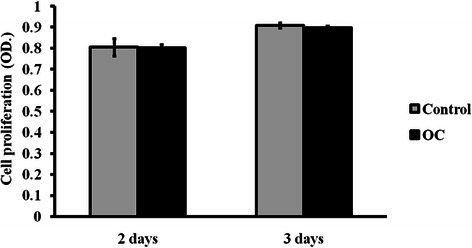
Fig. 5.

Analysis of cell proliferation using CCK-8 assay. 4T1 cells were incubated in either normal culture media (control) or osteogenic medium (OC). The numbers of viable cells are represented by O.D. values, which were measured at 492 nm. The error bars represent the standard deviation from five repeated measurements. * indicates p < 0.05, ** indicates p < 0.01, *** indicates p < 0.001
