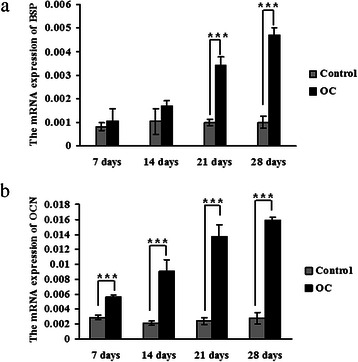
Fig. 6.

Detecting the mRNA expression of BSP and OCN in 4T1 cells using real-time PCR analysis. 4T1 cells were incubated with an osteogenic cocktail (OC). These cells, which were cultured in normal media, were used as a control. a BSP mRNA expression. b OCN mRNA expression. The expression was normalised to the expression of GAPDH. * indicates p < 0.05, ** indicates p < 0.01, *** indicates p < 0.001
