
Figure 1.
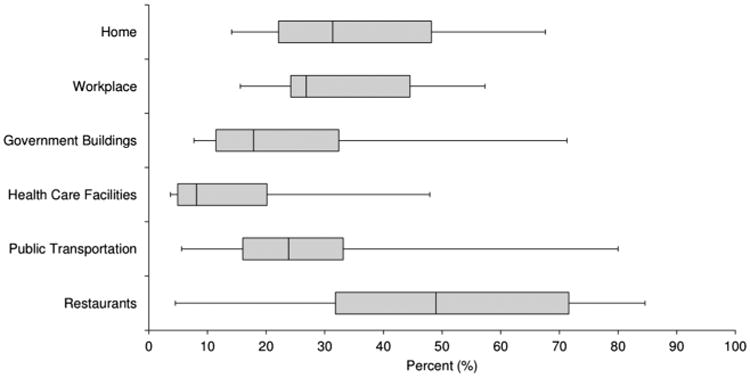
Box and whisker plots of the percentage of non-smokers exposed to secondhand smoke in 14 countries,† by location of exposure—Global Adult Tobacco Survey. †: Bangladesh, Brazil, China, Egypt, India, Mexico, Philippines, Poland, Russia, Thailand, Turkey, Ukraine, Uruguay, Vietnam. Note: Lower, middle, and upper ends of boxes represent 25%, 50% and 75% percentiles, respectively. Whiskers represent minimum and maximum country for each location.